 |
| The Amazing Fred Jacobs |
Monday’s
Jacobs Media webinar – Thirteen Years of
Tech Survey: How Radio Listening Has Changed with New Technologies – was an
extremely valuable experience for lots of reasons.
Fred Jacobs presented knowledge from 13 years of research about media usage by commercial radio listeners - Tech Survey's Greatest Hits.
As Bob Dylan once said Things Have Changed.
The
webinar was essentially a sales presentation (and a damn good one!) to recruit
more commercial radio broadcasters to participate in the upcoming Tech
Survey 2018. From a scholar’s point-of-view, the webinar was also an important Sociological
study that traced major changes in media and society since 2005.
[Please
note: Tech Survey participants are recruited from station databases. These are
“opt in” online responses that may, or may not reflect the entire population.]
A TIME CAPSULE FROM 2005
Jacobs’
webinar presentation started with the first Tech Survey in 2005. At that time
Jacobs Media was working primarily with commercial rock stations so the results
reflected the listeners of these stations.
Jacobs’
2005 Media Pyramid (on the right) depicts a world where people generally
listened to radio on “radios,” watched a lot of cable TV and kept their desktop
or laptop computers in the bedroom or the office close to a box of Kleenex.
Though
2005 isn’t that long ago, the media landscape was much different then: The
iPhone had not yet been introduced, Facebook had just been
launched, Netflix mailed movies to customers, and Broadband internet access was
available to only a few customers.
Many
of the leading media companies had not yet realized that big shifts in phone usage by their customers was already happening (chart on the left).
For example, Jacobs talked about how Arbitron (now Nielsen Audio) in 2005 only used
landline telephone numbers to recruit participants for its surveys. This was despite
the fact that over a third of listeners ages 18-34 were only available via cell phones.
At that time Jacobs Media was primarily working with rock stations as clients, Arbitron’s lack of including cell phone users in the sample was
obviously skewing the results. Jacobs showed this slide to Arbitron who
finally started including cell phone users a couple of years later.
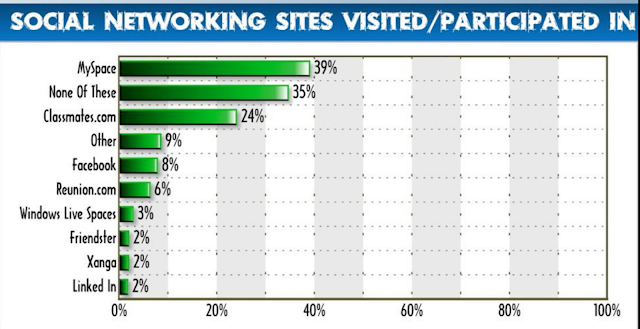
Another
slide from the Jacobs webinar (on the right) says a lot about how much things
have changed since 2005. At that time even the concept of social media wasn’t
widely discussed. In 2005, MySpace led the category at the time and then faded
to near oblivion.
Jacobs’
went through the subsequent years showing how digital gained share each year.
As new devices and platforms were launched more choices were available to the
respondents. The Tech Surveys themselves also evolved. Tech Surveys now include
listeners to stations airing 14 different formats. There are now separate surveys
for public radio and Contemporary Christian Music (CCM) music.
[Please
note: We will feature the latest public radio survey results – Public Radio
Tech Survey 9 – tomorrow/Thursday on Spark News.]
On
the left is the 2017 commercial station usage pyramid for devices and
platforms. Several years ago, Jacobs created a separate chart showing brand
preferences.
The devices and platforms gaining the most usage in 2017 were Smartphones,
Streaming Video, Smart TVs, Smart Speakers and Smart Watches. Radio usage has
declined only 2% since 2005, largely because of usage in vehicles.
KEN'S TAKEAWAYS FROM 13 YEARS OF TECH SURVEYS
I
highly recommend listening to this webinar – you can download it here [link]. These are a some of the factoids I consider to be the most important takeaways
from the 13 years of Tech Surveys:
(1.)
The introduction of the iPhone has permanently changed the way people consume
audio and video. Though the use of cellphones was significant in 2005, the
advent of the iPhone and its competitors beginning in 2008 has risen faster
than any other media device I can recall.
In
2012, four years after they first hit the market, Smartphones were used by over
fifty percent of Tech Survey respondents. In 2017 they were used by 87% of
respondents.
(2.)
Digital is continuing to gain ground on analog/traditional as the way to listen
to radio stations. The chart of the left shows the trend lines from 2013 to
2017 and each year the listening to radio via old-school analog receivers,
though still strong, continues to fall. If these trends continue (and there is
no reason to think they won’t) there will be a shakeout of a number of
commercial broadcasters because ad revenue will fall below profitable levels.
(3.)
Podcasting has become a real factor in the battle for listeners attention (chart on the right).
But
keep in mind that in 2017 podcasts are used by 21% of respondents and radio
(analog and digital) still is used by 91% of respondents.
Podcasts and radio
exist in two different economies.
(4.)
One of the negative factors that has emerged from the digital revolution is
addiction (chart on the left). Jacobs Media Tech Surveys findings mirror research from behavioral and
mental health professionals. It is well-documented that there is worrisome addiction by people to their “virtual worlds in a
box.” Addiction has consequences.
Overall,
this professor gives Fred Jacobs an A+ for his notable contributions media
literacy and cultural change.


No comments:
Post a Comment