 |
| King of Media Research, Fred Jacobs |
Jacobs
Media [link] has released slides from the commercial radio TechSurvey 2018 (TS
2018) after the debuting the results at the Worldwide Radio Summit earlier in
May in Los Angeles.
TS 2018 is one for three technology surveys that Jacobs
does each year. The Public Radio Techsurvey 10 (PRTS 10) is now being conducted
with results due in August at the Public Radio Content Conference [link].
Jacobs also provides a Tech Survey for Christian Music broadcasters.
The
Tech Surveys have become an authoritative source about the use of various media
devices and platforms. The baseline is people who listen to radio. Jacobs’ Tech Surveys have
become “data of record” for analyzing changes in media consumption. In this
post we will discuss the findings and a few limitations of Tech Surveys.
Jacobs
Media will host a Webinar about TS 2018 this Thursday
(3/24) at 2pm ET. More information about the Webinar can be found here.
INSIDE THE TECH SURVEYS
Perhaps
the best way to get to know Jacobs Tech Surveys is to start with the
methodology. The tech surveys are based on respondents who now listen to
radio. Most of the participants come from station databases and/or social
networking pages.
All of the responses were collected online. Jacobs provides a
disclaimer that the survey does not represent all radio listeners or even each
station’s audience.
The self-recruited sample
makes it difficult to compare the Tech Surveys to research that is based on
random samples. Tech Surveys can only be compared with other Tech Surveys. TS 2018 was based on 64,289 respondents from
567 stations.
TS
2018 and PRTS 10 are based on respondents who listen to stations with
specific formats. There are major differences between commercial radio formats and public radio formats.
The
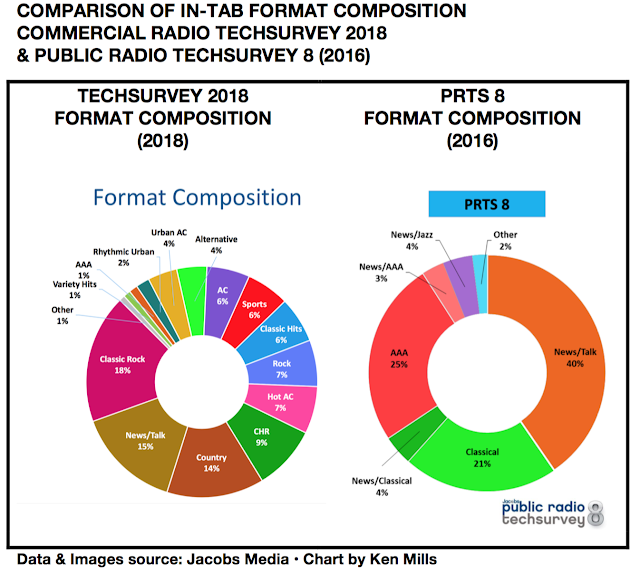
chart on the right shows a comparison between the in-tab formats from TS 2018
and PRTS 8 from 2016, the most recent information available.
In TS 2018, approximately 80% of the
respondents who listen to stations with music-based formats, particularly rock
music.
In PRTS 8, around 51% of the respondents listen to stations that air NPR
News/Talk programming.
ALL EYES ON THE MEDIA
PYRAMID
A
signature element of Jacobs’ tech survey is the summary chart called the Media
Pyramid. On the left is the Media Pyramid from TS 2018. It has a few surprises.
Smart Speakers are the fastest growing device/platform. Use of these devices almost doubled in
2018 from 2017.
Other
devices/platforms showing substantial growth in use in the past year include podcasts,
SiriusXM and, surprisingly, tablet devices.
The biggest drop in use of a platorm is HD Radio. HD appears to be headed toward oblivion.
OTHER SLIDES FROM TS 2018
OF INTEREST
Commercial radio respondents in TS 2018 overwhelming feel that
local-orientation is one of traditional radio’s primary advantages.
Note that the percentage of respondents who
agree with this statement has been increasing each year since 2016.
70% of respondents say they listen to "regular radio, either in a vehicle or
at home, work or school.
Note that listening to traditional radio on digital
platforms is increasing.
At work, over 54% of respondents say they listen to traditional radio on a
radio receiver.
Another 23% says they listen to broadcast radio streaming audio on computers and laptops.
The survey says that listening to podcasts most often occurs with
folks under 40.
This is new information! The reasons respondents say they
DON’T listen to podcasts is simple: they don't care about them.
There is no doubt that Smart Speakers is becoming part of American life.
Folks either think the speakers make life better or dismiss them as another barking dog in the corner.
Listening to SiriusXM continues to grow each year. The year-the-year
percentages aren’t big but the trend is undeniable.
Note that
millennial-age and Gen Z respondents are the least likely to use SiriusXM. If this trend continues into future years, listening
to satellite radio will eventually fall.


No comments:
Post a Comment